
Profit analysis
Every bot's realized profit, by day, by symbol and by bot.
Profit analysis adds up what all your bots, and your flywheels, have actually booked. It reads each bot's fills from the exchange's own record, so the numbers match your exchange history rather than an estimate.
Open it
- Go to Bots.
- Under All time, press "Profit analysis →".
- Pick a range at the top: 7D, 30D (the default), 90D or All.
Ranges are whole days ending today. Days are counted in UTC, so a trade late in your evening may fall on the next day's square, depending on your time zone.
The first time it opens, the page reads every bot's fill history from the exchange, which takes a moment when you run many bots.
The summary
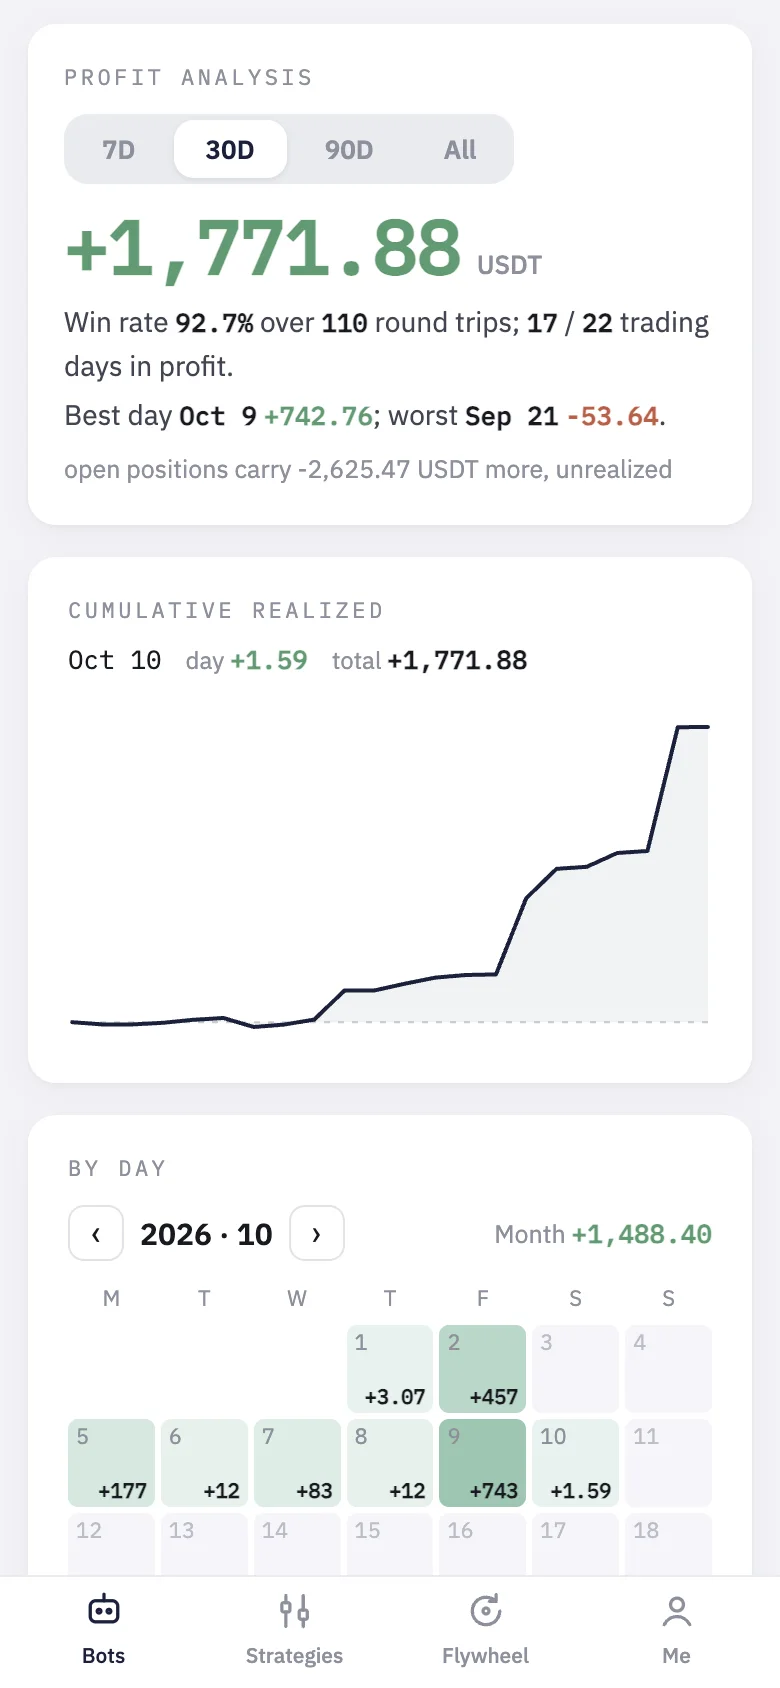
The top line is your realized profit in USDT for the range. Under it, two lines:
- The win rate and the number of closes in the range, and how many trading days ended in profit out of the days that traded. Each closing fill counts as one close, so a position sold in three parts counts three.
- The best and the worst day, with their dates and amounts. If nothing has closed yet, it says "No closed trades in this window yet."
Below that, a note says how much your open positions carry right now, unrealized. It is shown beside the total, never added to it.
The curve
"Cumulative realized" draws the running total of realized profit across the range. A flat stretch means nothing closed; a step down is a day that closed at a loss. Hover or tap the curve to read a single day: its date, the day's amount and the running total.
By day
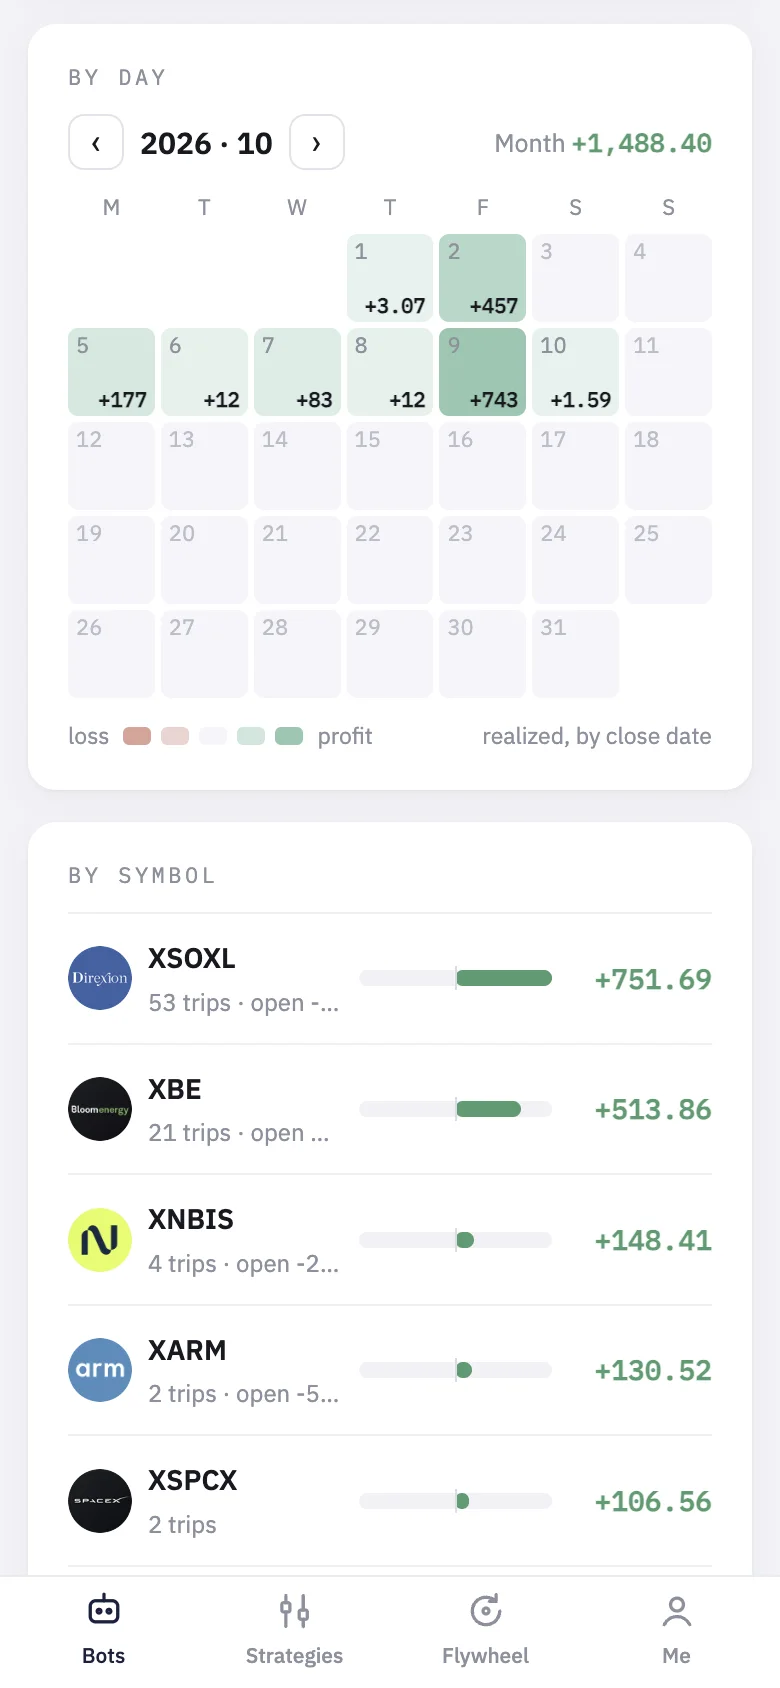
The "By day" calendar shows one month at a time, Monday first, with the month's total at the top. It opens on the month of your latest trading day; move between months with the arrows. Each day is shaded green for profit and red for loss, and the deeper the colour, the bigger the day. Days with nothing booked stay blank. The legend notes that days are "realized, by close date": a trade's profit counts on the day it closed, not the day it opened. A day that only opened a position can still show a faint red square: the exchange fee of that buy.
By symbol and by bot
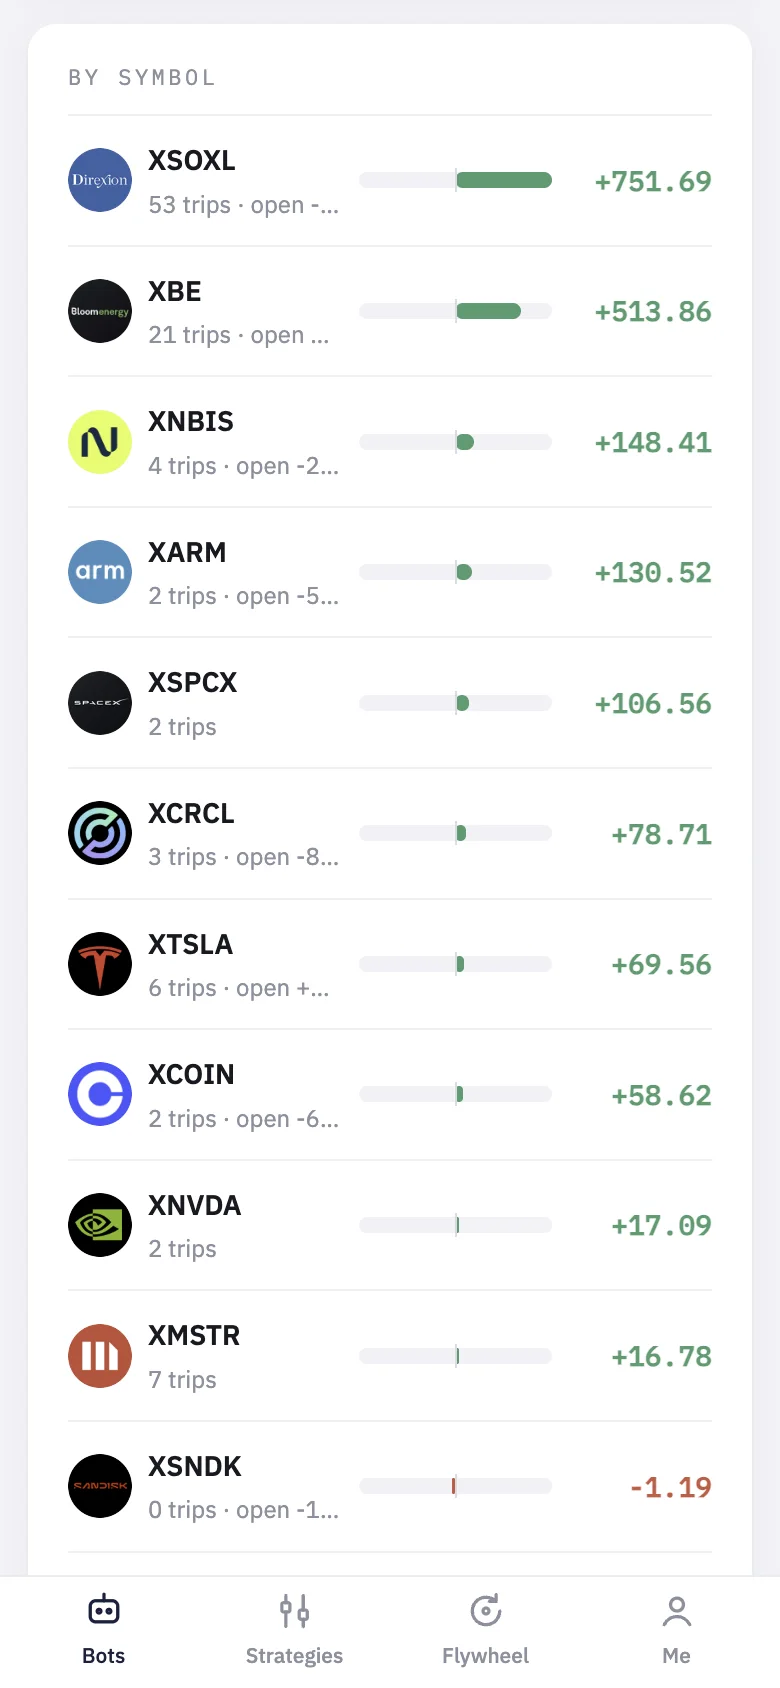
Two tables split the same total two ways, highest first, each with a bar that shows the size of the gain or loss.
- By symbol: which stocks paid. Each row shows the realized profit and the number of closes behind it and, where a position is still open, its unrealized amount.
- By bot: which bots paid. Each row shows the bot's name, its status (Running, Paused, Starting or Finished), how long it ran and its realized profit. Tap a row to open the bot. A flywheel is marked "flywheel · coupons" and opens its own page.
A bot appears when it booked a profit or loss in the range, or still holds an open position.
Realized and unrealized
Realized profit is booked when a trade closes, net of exchange fees. Unrealized profit is the paper gain or loss on positions still open, at the current price. The curve, the calendar and the totals use realized profit only, because an open position's value moves even on days nothing traded. That is also why the total here can differ from the Bots page: under "Running now", "Total" adds the banked and the floating amounts of the bots running now.
The platform fee
The figures here are your bots' profit before the platform's share. The fee is worked out from the same realized profit, by plan (30% on Free, 25% on Core, 20% on Premium, 10% on Generation), and only on the part above each bot's previous best. What is owed, if anything, is on Bots under All time and on the Payments page.
Common questions
- The numbers are a little out of date: results are kept for about two minutes. After that, pull down to refresh.
- A bot is missing: it closed no trade in the range and holds no position. Try All.
- My exchange shows a different figure: the exchange may include deposits, transfers or trades you placed by hand. Profit analysis counts only fills placed by your A9 bots.
- There is no export yet; your exchange's own trade history can be downloaded there.